Cellular and Molecular Neuroscience - University of Wisconsin-Madison
Notes and sketchy diagrams for NTP 610, the graduate course on cellular and molecular neuroscience by the Neuroscience Training Program PhD at UW-Madison, supercharged with a few additions of my own. Computer graphics are not of my authorship, with the exception of this one.
• Cellular Excitability
Prof. Shing-Yan Chiu's lectures.
• Resting potential
- action potential: all-or-none
- action potential: fixed amplitude
- resting potential: generated by K+ channels on normal cell
Non excitable cell (0 mV):
- Intracellular: 140 mM K+, 140 mM Cl-: electrically neutral
- Extracellular: 4 mM K+, 4 mM Cl-
Excitable (-90 mV):
- Add permeable K channel, therefore K+ ions leave cell until equilibrium (Nernst, aka reversal potential)
- velocity of decay/hyperpolarization depends on amount of channels.
• Single ion: Nernst
Three points about Nernst potential:
- only minute amount of K needs to leave in order to create big potential, due to capacitance properties of membrane.
- At Nernst equilibrium there's no further ion flow.
- Energy conversion scheme: concentration gradient -> electric potential
From Gibbs' actual/free energy:
but also ΔG is energy per Coulomb of transferred charnge:
therefore:
Where R is the constant for ideal gases, T is temperature, z is ion valence (either positive or negative), F is Faraday's constant, and E is the electric potential. K stands for "concentration" (not restricted to potassium). Therefore, the Nernst potential of an ion is:
substituting for K concentration levels:
Increasing outside concentration depolarizes cell log-linearly
• Multiple ions: GHK
- High Na2+ outside, low inside (opposite gradient).
- Na2+ has its own Nernst potential
- When both, resting potential lives somewhere in between (usually tilted towards potassium. PK:PNa = 1:0.03):
Resting potential with multiple ions is described by steady-state Goldman-Hodgkin-Katz equation:
No longer log-linear depolarization. Rapid increase, then log-linear:
There will be constant ion oscillations though, no steady state. That's why Na-K ATP-ase is needed to maintain steady state.
• Ion channels and patch-clamp
At rest, . During action potential, .
2 hypotheses:
- 1 ion channel which changes selectivity from Na -> K
- 2 distinct channels
Early evidence: TEA blocks K, TTX blocks Na.
Definitive proof: patch clamp of single channel protein.
From Ohm's law:
where ɣ is conductance (1/R) and Eion is the Nernst potential (its fingerprint), meanwhile V can be manipulated using clamping.
• characterizing ion channel with patch clamp
patch clamp modes:
- ON-cell patch: pipette contiguous to cell, yet without breaking membrane
- INSIDE-OUT patch: membrane patch is detached from cell, allowing scientist to change concentration on both sides.
- WHOLE-cell clamp: pipette contiguous to cell, breaking membrane. Measures whole-cell properties.
- OUTSIDE-OUT patch: like INSIDE-OUT, but membrane mosaic is reversed with respect to pipette.
• Ion channels
how do ion channels achieve such a high ion current (6 millions of ions / s)?
• Selectivity
In a typical protein, Radicals confer specificity, whereas backbone is featureless.
In a K channel, polypeptide chain resembles water-like polarity on the side that doesn't have the peptide Radicals (only Oxygen and Hydrogen). Radicals face outside, into the background.
"Featureless" hydrogens and carbonyl oxygens create specificity by creating a fake water tunnel.
Na isn't fooled, because channel is rigid and too wide for smaller Na atom to be surrounded by "fake water"
K channel: 6 transmembrane subunits. Pore depends on 5 or 6 peptides, common to all species and known channels.
Hypothesis confirmed by expressing crystals of this protein subset.
Screening domain at the opening of the Na channel doesn't need to span the whole pore.
• Gating
Voltage-gated state space:
        α
Closed ---> Open
       <--
        β
Movable gate lever is positively-charged particle called q.
Proposed mechanism (q+ is electrically attracted to be on either side (close or open), but not in the middle). Symmetrical energy barrier.
when voltage is applied on either side, q+ is "biased" to go to one side (the one that is more negatively charged). Energy barrier is tilted.
open/close rate constants (exponential growth/decay). Constant units are Hz.
Probability of being open at steady state is sigmoid with image [0, 1], perfectly odd, centered at 0.5.
Probability as function of time:
rising phase:
decaying phase:
With time constant
Meanwhile, the current observed in oscilloscope, encompassing N gates:
• Single channel kinetics
Each individual voltage-dependent channel behaves as a memory-less stochastic square pulse train, yet IK follows characteristic curve, because group behaves as IK on average.
     ___    _______   _
____|   |__|       |_| |____
--->     -->       ->   ---->
dwell times (closed periods)
what is the relationship between opening rate α and dwell time? roughly speaking, the smaller the α, the longer the dwell time.
where ΔG is the height of function.
histogram of dwell times (exponential distribution). In other words, most channels open early:
with mean dwell time = 1/α.
what if each channel has a different α? still an exponential PDF:
going back to both O and C, suppose 2-state model with rates:
        α = 100/s
Closed ---> Open
       <--
        β = 1000 /s
There will be 2 exponential PDFs of dwell times, one per state. substituting parameters (α for C, β for O)
• multiple states
real channels have much more states:
        α         β_2
Closed ---> Open ---> Closed2
       <--       <---
        β         α_2
PDF of dwell times in O will still be single exponential
same for Closed states, however, there's no way to tell which closed state the protein is in, therefore, measurement will show single plot with a sum of 2 exponentials.
Many possible state diagrams, even for same alphabet:
C_1 <-> O <-> C_2
or
C_1 <-> C_2 <-> O
or
      O
    /   \
  C_1 -  C_2
• Macroscopic currents
continuing with 2 state model, single channel (Ohm's law again, g is conductance, Po is either 1 or 0):
meanwhile at the macroscopic level. (Po ranges from [0, 1]):
substituting Ng for constant c:
macroscopic circuit (with time constant , different from the microscopic τ presented before):
          Capacitor (phospholipid layer)
         __| |__
        |  | |  |
        |       |
inside -|       |- outside
        |       |
        |__/\/__|
           G_L (leakage conductance, channel)
Voltage source is added in series to resistor, to account for that ion's electrochemical force (Nernst potential).
              C
         _____| |_____
        |     | |     |
        |             |
inside -|             |- outside
        |       |     |
        |__/\/__|  |---
                |
           G_L   E_k
Leakage I-V curve is straight slope (up is outflowing ions). More voltage, more positive (outgoing) current.
Then, extra parallel C+Ek lines are added for each ion in the full Hodgkin Huxley model (notice GLeak is separate from ions)
Na channel I-V curve:
• Na-channel dynamics (depolarization)
Perturbations around resting potential fixed point (a stable fixed point, aka attractor), still below activation threshold.
- Hyperpolarizing:
- Depolarizing:
Perturbation above activation threshold (unstable fixed point, aka repulsor:)
Next stage is repolarization of action potential, due to the late opening of K-channels and inactivation of Na-channels.
• K channel disease
Molecular basis for diversity:
- many genes
- mix and matching subunits (monomeric subunits, polymeric)
- splicing
- posttranslational modification
- beta subunits added, post translation
100s of genes, yet each individual K channel isn't redundant. Single mutation can lead to neuropathology:
Kv1.1 knock-out -> Episodic Ataxia (EA), uncontrollable peripheral (skeletal) motion after stress.
• Na inactivation (HH)
activation is much faster than inactivation.
activation >>> fast inactivation > slow inactivation
inactivation is not the reverse of de-activation. It needs a different molecular process
voltage-gated Na-channel has 2 gate subunits, m and h:
- activation (m gate, fast): αm, βm
- inactivation (h gate, slow): αh, βh
        outside
 ________    _________
       m  \
 ________\  h_________
          \
        inside
  ++++depolarized++++
inactivation (h) rate curves are the opposite of (m), but slower. current only flows when both of them are open, in other words, the product of their respective Po.
fraction of occupancy curves are the same, but mirrored.
Units are independent stochastic processes. Random direct jumps from closed state to inactivated state (silent traces), were predicted by HH before they could be verified with single-channel patch clamp in the 80s:
C -> O -> Inactivated
\________/
   silent traces (1% or 2% of time)
Failed prediction: βh is not a voltage-dependent particle inside membrane, but a ball-chain hanging outside, for fast inactivation. open times are constant, despite change in V.
• Na inactivation (Ball-chain)
blocking in squid's giant axon was already hinting at a separate ball-and-chain terminal dangling outside the protein and responsible for fast inactivation.
there are 3 tails to each side of the TM passes (3 N-terminals, 3-C terminals). both sides play a role in inactivation, but only one of them is well elucidated (N-terminals).
chain-ball is one of those tails. Very end (telomere) is hydrophobic. proximal part is hydrophilic, therefore it rolls like a ball.
ball-chain is not V-dependent. It swings randomly until plugging into channel by accident (thermal vibration).
   α    κ
C -> O -> Inactivation
  <-   <-
   β    λ
Mutations:
- wrong ball size: bursting times unaffected (because tail is same length still), but inactive period is shorter because ball is quickly released.
- wrong chain length: bursting duration affected, inactive period unaffected.
• Activation
steep Po(V) of Na channel is key to physiology of activation. how do we increase steepness of sigmoid?
normal:
  α = q
C -> O
  <-
  β
steeper:
increase α = 4q. that is, charged particle in gate is 4 times more charged. normal curve of energy barrier becomes taller, but in time domain activation increases astronomically.
- q: 1 ms
- 4q: 1 trillion years
- 12q: actual channel actually moves 12q when open. what gives?
channel is activated in steps via cooperativity, and actual sigmoid is compromise between q and 4q. only 1 subunit opens at a time, this creates some delay.
no delay in turning off currents, however. all it takes is 1 subunit to go back, and ion current will be off.
how can we measure opening of subunit? gating current: small pulse-like currents from ions already trapped within channel/membrane, as they flow in when single subunit opens.
mutations in Nav1.2 channel show Subunit 4 is the voltage sensor (same for K Shaker channel, Cav1.1, HCN1 Ih channel and CNG1 channel). neutralizing its peptide charges destroys voltage sensitivity.
whether mutation affects more intra or extra-cellular peptides biases Po.
evidence for physical movement of S4:
- biotin-avidin assay
- Fluorescence Resonance Energy Transfer
• Presynaptic Mechanisms
Prof. Meyer B. Jackson
Synapse (σύναψις: conjunction, strong union), coined by Sherrington in 1897.
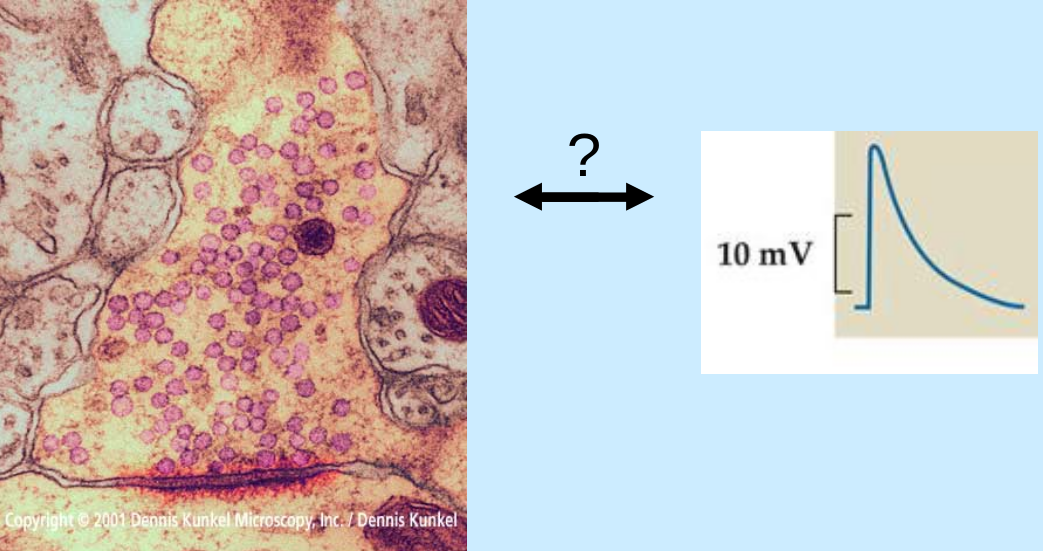
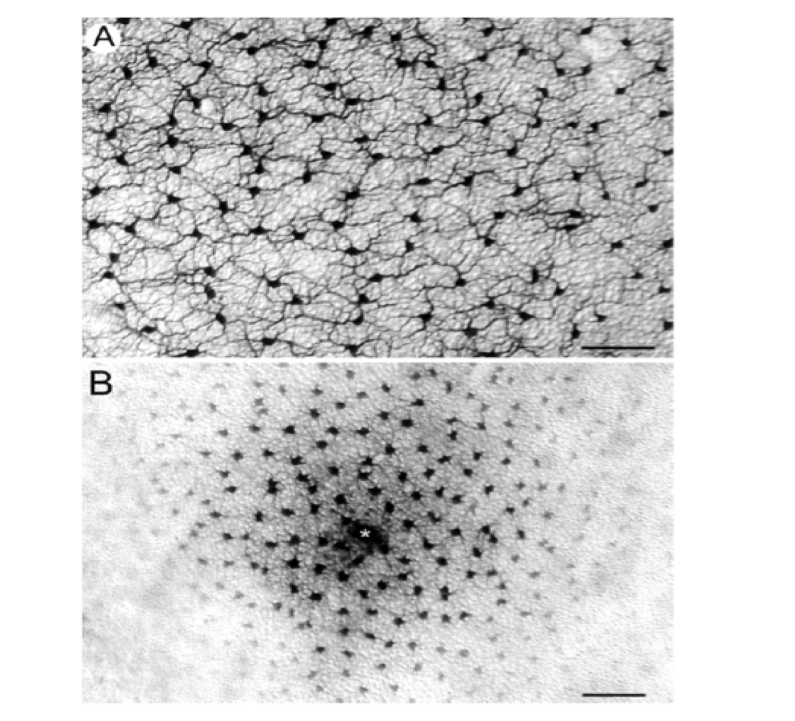
characteristic ultrastructure of synapse (as seen from EM):
- lots of (pre) synaptic vesicles
- synaptic cleft ~20 nm
- post-synaptic density
• Classification
by contact:
- electric (gap junctions): single step, bidirectional, fast
- chemical (neurotransmitter+receptor): multiple steps, one direction, synaptic delay (~1 ms)
by effect (speaking of chemical):
- excitatory: ligand-gated Na/K channels, fast (.5 ms - 5 ms)
- inhibitory: ligand-gated Cl channels, somewhat slower (.5 ms - 5 ms)
- modulatory: GPCRs acting downstream on channels, much slower (50 ms - 5 s)
• Transmitter apparatus
to use a particular neurotransmitter, neuron must have means to synthesize it. requirements:
- synthesis
- storage/packaging
- release into cleft
- receptor activation
- removal/degradation/reuptake
with the exception of (3), all steps are transmitter-specific.
big synapses which allow for recordings:
- squid's giant axon/synapse
- Calyx of Held in auditory brain stem (chochlear -> trapezoid body), young animals.
ACh receptors were first to be found (~1981). found in neuromuscular junction as well as spinal cord, permeable to both K and Na.
• Quantal release
- Axelrod: proved existence of vesicles using EM in rat pineal gland
- Fatt & Katz, 1951, 1952: spontaneous blips at neuromuscular junction, small miniature random PSPs (minis), observed only at endplate.
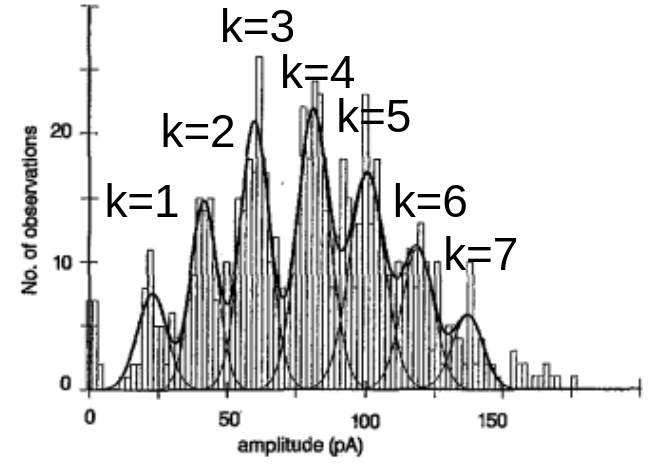
- Del Castillo & Katz: fluctations of Ach come in discrete values. number of observations as function of end-plate potential is a distribution with many peaks (multimodal).
summation of quanta (stochastic model):
- N = total number of release sites
- p = probability of release at each site
- q = voltage change produced by one vesicle (quantal size)
PSP of magnitude v produced by k quanta has amplitude:
average number of vesicles released per trial is:
m is referred to as (quantal content)
therefore average EPSP is:
number of vesicles released, k, varies from trial to trial according to binomial dist:
with low Ca and high Mg (for large N and small p), the binomial dist approximates the Poisson dist:
for k=0,
which means m can be determined by looking at the number of failures (failure to release vesicles, despite stimulation), for any given stimulation magnitude.
how big is a quantum?
- neuromuscular Ach: 5000-10000 molecules, Kuffler & Yoshikami, 1975
- glutamatergic: 1200-2000, Edwards, 1995
• pre vs post
m, quantal content (average # of vesicles) serves as index of presynaptic strength.
q, quantal size (voltage by one vesicle) serves as index of postsynaptic strength.
therefore, measuring m and q serves as basic method of finding locus of change in synaptic strength.
sources of quantal variability:
- different vesicle volume
- different degree of loading
- different fractional release
- different alignment (receptor density)
quantal release detected by other techniques:
- Heuser and Reese designed machine to freeze tissue exactly after stimulation, allowing EM to photograph vesicles fusing into membrane.
- capacitance measurement: capacitance is proportional to Area, and it turns out that membrane capacitance in patch clamp actually changes in discrete steps. there are 2 kinds of steps, corresponding to 2 types of vescicles: dense core and micro/fast.
- amperometry: NE and serotonin can react upon contact with certain electrodes, releasing e- in the process which are measured as quantal spikes by electrode.
- fluorescence staining
Dense-core vesicles are intracellular lipidic vesicles released by neurons for neuromodulation of synapses. They tend to contain neuropeptides (e.g. substance P, opioids), which are bigger molecules than catecholamine-based or single aminoacid-based trasmitters. This makes them denser to imaging techniques such as EM. In addition, they are bigger, and are released after considerable delays in presynaptic activity.
• Calcium
cells care about calcium
- PMCA: plasma membrane Ca2+ ATPase pump
- NCX: Nitrogen-Calcium exchangers
- Ca2+ channels
extracellular Ca2+ concentration is higher. ECa = 120 mV.
- 19th century Ringer's solution: Ca2+ was found to be essential to keep frog's heart beating.
- 1964 Douglas & Poisner: Ca needed in bathing solution to get release of epinephrine from adrenal gland, and vassopresin from posterior pituitary (neurohypophysis).
- 1967 Katz & Miledi: Ca needs to be at nerve terminal before stimulation, Mg2+ inhibits the action of Ca2+.
Miledi & Katz's experiment on squid's giant axon:
   ___
__|   |__> I
     |\
   __| \
__/     \__> V
       ^
       due to voltage dependent Ca2+ current
   ^
   normal rising phase due to Na+
Fura-2: designed chelator molecule which changes fluorescence, invented by Tsien of GFP fame. Descendent: Fluo-5F
Natural Ca chelators
- Calbindin
- Calretinin
- Parvalbumin
• Channels
Ca2+ channels aren't perfectly selective to Ca2+ only, other ions get in. Therefore I-V curve doesn't reverse exactly at ECa.
- 4 subunits
- pore loop very similar to Na channels
- point mutation at pore loop converts it from Ca2+ to Na+ pore.
types:
- L-type (1.1 - 1.4)
- P/Q, N, R (2.1, 2.2, 2.3)
- T-type (3.1 - 3.3)
by selectively blocking using toxins from spiders and cone snails, type 2 channels were shown to be the ones involved in presynaptic release.
• Release
Ca2+ triggered by exocistosis in cooperative mechanism. vescicle surface is full of proteins. most abundant is synaptobrevin.
key proteins in release:
-
3 SNAREs:
-
synaptovrebin (aka VAMP)
- syntaxin
-
SNAP25
-
synaptotagmin: binds to phospholipids, SNAREs and itself; when Ca2+ is bound.
botulinum toxins (tetanus toxin, which cleaves synaptobrevin) block syntaptic transmission. tetanus toxin turned out to be a protease requiring Zn.
classification by location
-
on the surface of vescicles:
-
synaptobrevin
-
synaptotagmin
-
cell membrane proteins involved:
-
SNAP25
- syntaxin
• SNARE complex
from yeast to humans, vesicle fusion from one membrane to another is highly conserved. synaptic release leverages homologue mechanism.
SNARES on vesicles are called v-SNAREs, SNAREs on target membrane are called t-SNARES.
SNARE motifs comprise ~65 amino acids with helical tendency. they assemble into trimeric complex (1 syntaxin, 1, synaptobrevin, 2 SNAP-25).
the complex functions as ropes which pull membranes together. demonstrated using fluorescence on glycoproteins (Weber at al 1998, Cell).
- 2 target proteins originally close in vescicle membrane.
- fusion
- fluorescence diminishes because proteins get further appart as their membrane fuses with target membrane.
however this doesn't require Ca2+. What's the Ca2+ sensor?
• synaptotagmin
different membrane protein is responsible for sensing Ca2+: synaptotagmin. actually a whole protein family: SYT[1-17], ESYTs and others.
- ɑ-helix as TM.
- C2A subunit in proximal ECD (relative to membrane)
- C2B subunit in distal ECD.
several aspartate radicals bind Ca2+
unsolved puzzle: SYT works on the seconds timescale, it's too slow to constitute the crucial synaptic mechanism.
• GPCRs and G-proteins
ligand-gated vs G-protein divide:
| transmitter | ionotropic | GPCR |
|---|---|---|
| Ach | Nic | Musc |
| glutamate | iGluRs | mGluRs |
| GABA | GABA_A | GABA_B |
| serotonin | 5HT3 | 5HT1, 5HT2 |
| other amines (NE) | y | |
| hormones | y | |
| peptides | y | |
| photoreceptors | y | |
| olfactants | y |
many co-transmitters are GPCR-only as well.
• GPCRs
Cellular signaling can be more complex than ionotropic receptors. G-protein-coupled receptors were first discovered for glycogenolysis. Glycogenolysis increases blood flow and sugar in fight or flight responses:
epinephrine -> liver -> glycogen breakdown to glucose
search for hormone receptors in liver. search for protein in tissue which binds to epinephrine. it started with β-adrenergic receptor, which is homologous to rodopsin.
hydrophobicity profile showed it has 7 TM domains.
• Classification
largely conserved. family tree goes as far back as prokaryotes. Human GPCRs can function in yeast. Low sequence conservation however, conservation is at the level of higher-order structure.
G-protein coupled receptors is the most abundant family of membrane receptors. they are involved in vision (rodopsins), olfaction (ORs), dopamine receptors, opioid receptors, histamine, vasopressin, adrenaline, etc. They are the target of 30% - 40% of all drugs.
- class A
- class B (secretin)
- class C (glutamate)
- adhesion
- frizzled
opioid receptors:
- mu
- kappa
- delta
most common endogenous opioid peptides in humans:
- enkephalins
- endorphins
- dynorphins
structure-function:
- allosteric receptors
- most binding sites are extra-cellular
- ligand-binding domain is called "cradle"
different ligands have different actions
- full agonist (e.g. epinephrine)
- partial agonist (many drugs)
- neutral antagonist (few drugs)
- inverse agonist (most antagonists)
• G-protein
- 1971: Martin Rodbell showed GTP was involved in intracellular signaling in activation of adenyl cyclase
- 1977-1979: cell line with proteins which bind GTP, which he dubbed G-proteins.
diversity not as wide as GPCRs.
transduction cycle:
- unbound
- binding: GDP (intra) still coupled to Gɑ
- GTP replaces GDP, binding Gɑ
- Gɑ and GβGɣ dissociate (Gɑ is released)
- transduce signals: both released Gɑ and attached GβGɣ may produce cascades
- Gɑ slowly hidrolizes bound GTP, complex reassembles again
Targets:
Gɑ -> adenylate cyclase -> cAMP -> PKA
G-protein -> phospholipase C --> DAG -> PKC
                             \-> IP3 -> Ca2+ release from endoplasmic reticulum
• kinases
- cAMP-dependent
- cGMP-dependent
- Ca-calmodulin-dependent
- Ca or diacylclycerol-dependent
G-protein is a signal amplifier
- signal
- G-protein/effector enzyme
- second messenger
- activated kinase
- activated enzyme
- activated enzyme
- activated enzyme
- activated enzyme
- etc...
- activated kinase
- second messenger
- activated kinase
- etc...
- activated kinase
- second messenger
- G-protein/effector enzyme
- second messenger
- activated kinase
- etc....
- activated kinase
- second messenger
- ad nauseaum
- G-protein/effector enzyme
• Plasticity
many presynaptic mechanisms of short term plasticity (targets). Pretty much anything affecting Ca levels will result in short-term changes in release, until Ca levels are restored.
- action potential
- Ca levels
- Ca channels: because it regulates release
- other channels: "
- available vescicles
- autoreceptors
- GPCRs
- pumps? (speculative)
- mitochondria: they regulate cytocolic Ca
- postsynaptic receptors: more expression, desensitization
• potential broadening
mossy fibers in hippocampus show broadened (slower action potential) after high-frequency pulse train. synapse is facilitated with burst in DG. Caused by K+ channel inactivation.
• Facilitation with Ca
NMJ of crayfish claw opener, due to residual Ca2+. if Ca is elevated after first spike, then why is there no release during the inter-stimulus interval? first of all, sensor complex in vesicles has limited binding sites. also, there is a distinct facilitation sensor (NCS-1) at the exocytocis mechanism.
• Depression with Ca
there are buffer calbindin proteins which must store Ca before delivering to vesicles.
Calbindin is a natural calcium chelator (surrounds Ca2+ ions). These proteins act as Ca2+ buffers at nerve terminals, limiting the availability of free intracellular Ca2+ in the presynaptic neuron before exocytosis. They underlie a form of paired-pulse facilitation, as shown by Blatow, et al. (2003) with calbindin-KO mice, for which this kind of short-term plasticity is lost.
• potential slowdown
slow responses in bullfrog sympathetic ganglions are mediated by different transmitters (Glu, Ach, Leutenizing Hormone Releasing Hormone), each with a different EPSP/IPSP timescale (from ms, to s, to min).
ligand-gated neuromodulators almost always trigger G-protein coupled signaling cascades. e.g., cholera toxin attacks G-protein ɑ subunit.
Also, K+ channels are modulated by G-protein directly, without need for 2nd messengers.
Ca2+ as second messenger can also interact with some subtypes of K+ channels (KCa channels, BK, SK, IK). they are responsible for hyperpolarization right after rising phase of action potential.
• habituation
case study: Kandel's aplysia and gill withdrawal reflex:
- habituation: if repeated stimulation at siphon is not accompanied by adverse effect in tail, animal habituates and no gill withdrawal takes place. this is due to facilitatory interneuron which lacks nociceptive sensory signal from tail. This probably results in inactivation of presynaptic Ca2+ channels and depletion of vesicles.
- facilitation: if stimulation does have adverse effect, gill withdrawal response is increased. This is because of facilitatory interneuron activates GPCRs in the presynaptic terminals, and the extra GTP+Gɑ activates the adenylate-cyclase → cAMP cascade, which increases Ca2+ influx. Also, PKA is activated, which phosphorylates and inhibits certain K+ channels, slowing repolarization.
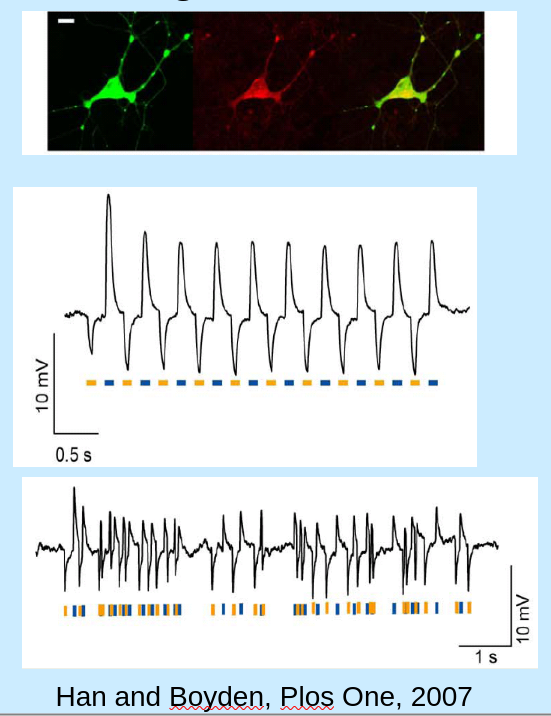
• case study: optogenetics
• CRE-lox driver:
- promoter specific to some kind of cell
- stop codon
- loxP site (short aminoacid sequence after stop codon)
- GFP
CRE-recombinase splices the loxP, so that the GFP will also be expressed in that cell type.
• GECIs
Genetically Encoded Ca Sensors. synthetic fusion of:
- GFP (circularly permuted)
- calmodulin
- M13 kinase
when Ca binds calmodulin, it changes conformation of GFP, which changes fluorescence, which is leveraged by optical imaging (e.g. 2-photon microscopy) to record intracellular Ca2+ transients (albeit at a relatively slow timescale). GCaMP is the most popular one. E.g., the GCaMP6s variant is one of the “slow variants” (the ‘s’ stands for slow), which often provide increased sensitivity compared to the variants with faster temporal resolution.
• GEVIs
Voltage sensors. faster than Ca sensors. also synthetic voltage-sensing molecules attached to GFP dye.
quantum dipole moment changes from ground state to excited state in presence of stronger electric field. absorbance spectrum shifts as a result, creating small but noticeable fluorescence change.
Siegel & Isacoff (1997) paper: early attempt in oocytes.
GEVIs currently available:
- hVOS: very good (single-spike) time resolution.
• channelrhodopsin
channelrhodopsin-2 GPCR (like bacterial rhodopsin, but it opens channel upon lighting instead of closing it) discovered in Deisseroth (2005) paper. found in a species of green algae. core protein is 315 aminoacids. needs trans-retinal to function.
- under voltage clamp, light produces current.
- under current clamp, long light pulses produces spiking. short light pulses produce subthreshold PSPs or pulse-coupled spikes.
retinal (conserved in our retina) is isomerized upon reaction with photon, forcing conformation change with channel.
Opsin based optogenetics arsenal:
- channelrhodopsins: Na, K, Ca, H influx
- halorhodopsins: Cl influx
- archearhodopsins: H outflow
• Postsynaptic Mechanisms
Prof. Mathew Jones lectures.
• Pharmacodynamics 101
how were receptors discovered?
- 1878 Langley was working with salivary glands of cat:
pilocarpine: agonist which mimics physiology of drug. atropid: antagonist
Langley proposed existence of receptive part in tissue, which certain chemicals can excite or inhibit.
- 1908 A.V. Hill, preparation of frog's leg muscle bathed in solution, muscle in turn was linear actuator to draw its own contractions over rolling paper.
nicotine application:
  ____
_|    |__
capacitor-like plot (due to law of mass action)
  ____
 /    |
/      \
-------> time
simplest differential equation, with S being concentration of "stuff":
2 hypothesis about muscle contraction:
Mechanichal hypothesis:
          k
 N_{out} ---> N_{in}
         <--
          k
turning it into a difference equation for numerical integration (substituting rhs for constant F):
therefore
Chemical hypothesis:
                    k_{on}
N    +     Receptor ---> N+Receptor
                    <--
                    k_{off}
(product NR is due to joint probability of there being both N and R).
• EC50 and KD
EC50 is the empirical concentration in Mol at which NR (response) is half of maximum.
on the other hand, the closely related affinity constant is given a priori by the state model:
• Hill equation
then, Hill's equation is:
dose-response curve:
NR (response)
|     ------> saturates
|   /
| /
|___|_______> log[N]
   EC_50
a drug with less affinity would require higher doses for the same response (horizontal shift):
NR (response)
|          ------> saturates
|        /
|      /
|____/
|_______|________> log[N]
      EC_50
not all change is due to affinity/binding. there's efficacy/efficiency too (e.g. channels become "more open"), which causes up-shift in dose-response curve, while EC50 stays the same:
NR (response)
|       ------> saturates
|     /
|   /
| /
|/
|___|_______> log[N]
   EC_50
Evidence for opening/closing of channels after transmitter or drug binding.
- 1951: Fatt & Katz
- 1959: Takeuchi & Takeuchi
muscle end plate preparation (neuromuscular junction). current clamp, and letting V in muscle vary as function of I.
V
|/\/\/\/\
|_________> t
I
|/\/\/\/\
|_________> t
after application of Ach to preparation:
           _____
V         /     \
|/\/\/\/\/       \
|_________> t
I
|/\/\/\/\/\/\/\/\
|_________> t
if V increases even though I is stationary (quasi-constant), that means Ach is reducing resistance (Ohm's law).
Ach-R are mixed cation channels (they allow both K and N to go through). that is, opening those channels is driving reversal potential to ~0 mV.
using voltage clamp they found that reversal potential was neither that of Na nor K:
G
|__  _________
|  \/
|__  _________
|  \/
|------------- ~0 mV
|--/\________
|__/\_________
|________________________> t
(bumps are due to Ach application)
• Excitatory transmission
general rule:
-
excitatory potential: reversal potential of ion-provoking postsynaptic potential lies above threshold potential, regardless of whether potential is driven up or down.
-
inhibitory potential: reversal potential of ion-provoking postsynaptic potential lies below threshold potential, regardless of whether potential is driven up or down.
in other words, whether transmitter is excitatory or inhibitory for a given neuron is solely determined by the position of its ionic current's Nernst/GHK potential, relative to cell activation threshold.
• AMPA/Kainate vs NMDA
experimental history:
- 1984: Mayer & Westbrook
- 1984: Ascher
CA3 -(glutamatergic)-> CA1
    ^                   ^
    induce spikes       recording site
EPS currents:
I
|__/-----\____
|__/--\_______
|------------- ~0 mV
|--\__/-------
|--\_____/----
|________________________> t
   ^    ^
   fast ^
        ^
        slow phase before going back to rest
fast (I-V curve, perfect straight line):
      /
    /
  /
/
V-clamp and I-clamp parametric curves look the same as the previous experiment, similarly for I-V: reversal potential is ~0 mV. blocking either Na or K moves reversal potential to that of the other ion. i.e. similar to N-Ach receptor.
slow:
However, slow phase is due to different receptor. I-V curve is sensitive to Mg2+ (although it still reverses at ~0 mV, so it allows both Na and K in and out).
      /
     /
____/______
\  /
 \/
by blocking Mg2+, it becomes a perfect straight line. at hyperpolarization, Mg2+ is attracted towards cell due to mere electrostatic force (it's a cation, and cell is hiperpolarized), which in turn blocks NMDA pore. therefore I-V curve is slow to go up, momentarily.
additionally, NMDA receptor also allows Ca2+ to flow.
- fast: AMPA (antagonists: DNQX, CNQX)
- slow: NMDA (antagonists: APS, APV)
• Inhibitory transmission
IPS currents:
I
|__/-----\____
|__/--\_______
|------------- ~ -75 mV
|--\__/-------
|--\_____/----
|________________________> t
-75 mV is close to , and it was shown experimentally to be the involved ion.
many barbiturates (e.g. propofol) and sedatives (e.g. benzodiazepins) work by enhancing GABAr.
• Ligand-gated channels
• Pentameric LGICs
Pentameric ligand-gated ion channels. A.K.A. cys-loop receptors due to presence of a disulphide-bridged loop in the extracellular domain, although recently discovered bacterial homologues do not contain the disulphide bridge.
Superfamily of proteins responsible for fast response to the following:
- acetylcholine (nAch)
- serotonine (5-HT3)
- g-aminobutyric acid (GABAA, GABAC)
- glycine
Multiple subunit isoforms and splicing contribute to variance.
Structure:
Most complete structure comes from nAch of Torpedo marmorata (electric ray). Ring of 5 subunits, each one with a β-sheet-rich extra cellular (EC) domain, a ɑ-helix-rich transmembrane domain (TM) and a poorly known intracellular domain.
Between 2 and 5 binding sites at ECDs, depending on type. cys-loops communicate ECDs and TMDs. Each TMD has 4 ɑ-helices, one of which (M2) contributes to channel itself.
Physiology:
- Binding at interface of complementary ECD loops -> conformational change.
-
Coupling: loop-C capping and receptor priming "traps" agonist and transmits energy downstream.
- Evidence of pre-activation and flip states, before fully open state. Whether agonist is partial or full might depend on how efficacious it is to move from flip to open state.
-
Gating of ions (different agonists induce it with different efficiencies, more agonist molecules induce it more because of extra affinity).
transmembrane domains of Cys-loop receptors, particularly GABAA receptors, contain binding sites for a range of clinical and endogenous modulators. 15' residue of M2 is often a key determinant: water-filled external cavity seemingly capable of accomodating drugs.
• Tetrameric iGluRs
ionotropic glutamate receptors (AMPA, kainate and NMDA). Main mechanism for fast excitatory transmission at the CNS.
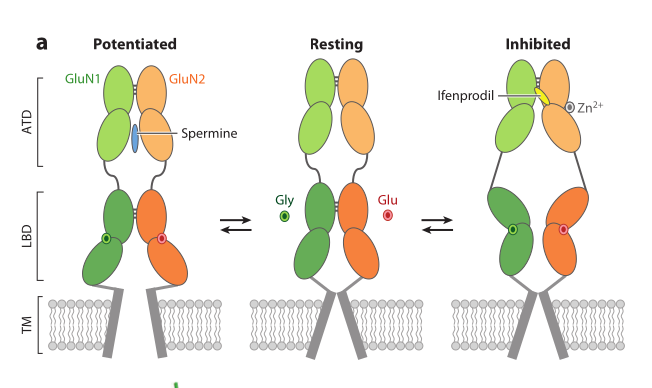
Genetic and posttranslational editing generate iGluR subtypes with diverse kinetics, Ca2+ ion permeability, and sensitivity to voltage-dependent ion channel block by extracellular magnesium (NMDAr) and cytoplasmic polyamines.
There's evidence of presynaptic iGluRs, but their function is less well characterized. Embryonic vs adult subunits can be strikingly different, although role of ontogeny is poorly understood. Glial cells also express some iGluRs (e.g. oligodendtrocytes).
3 major families (named after preferred agonists):
- AMPA (GluA1–4 genes)
- Kainate (GluK1–5 genes)
- NMDA (GluN1 + GluN2A–D or GluN3A–B genes)
- fourth family: GluD1 and GluD2 genes, widely expressed in cerebellum, yet unresponsive to glutamatergic or glycinergic activation. Poorly understood.
Structure:
The 18 vertebrate iGluR genes have a unique conserved structure. iGluRs also found in insects, nematodes and primitive eukaryots. Each monomer is divided into:
- TMD (4 passes): pore-loop helix flanked by 3 α-helices, with characteristic SYTANLAAF motif in M3 helix.
- ECD (dimer of dimers):
- Ligand-Binding Domain (LBD) subunit (proximal to membrane): 2 domains (A+D or B+C subsubunits).
- Amino-terminal Domain (ATD) subunit (distal to membrane): 2 domains (A+B or C+D subsubunits)
Plus auxiliary proteins that interact to regulate iGluRs: TARPs, CKAMP44, CNIH-2, SynDIG1 (AMPAr); NETO1/2 (KainateR); NETO1 (NMDAr).
Physiology:
Models tend to define 3 states: closed, open and desensitized. computational models suggest pore closure-opening is due to M3, which in turn is moved by LBD. Distal and proximal subunits serve different roles in activation.
In NMDAr, glycine binding to GluN1 LBDs is not enough for activaton, whereas in KainateR, binding to only proximal GluK5 is enough as a partial agonist. Partial Glu binding to GluK1 produces mild desensitization, strong one after binding to GluK5.
Assembly of channel is started by ATD. ATDs (GluN2A–D subunits) are also key to allosteric modulation. E.g., GluN2A has a Po = 0.5, whereas for GluN2B it is only 0.12, and even lower for B and D. Probably due to ATD-LBD linker.
NMDA receptors are heteromeric coincidence detectors requiring binding of both glycine and glutamate and that all 4 LBDs be occupied . Unlike non-NMDA receptors, for which binding to fewer than four subunits can trigger partial activation.
• Shaping of synaptic potential
membrane capacitor + single leakage channel:
more generally, for any number of different neurotransmitter receptors:
algebraic trick to solve for V as steady state as a function of equilibrium potentials V(E), assuming C=1 and dV/dt = 0:
chord conductance (steady state trick):
• Dendritic integration
• Temporal summation
in real synapses in CNS, injected Isyn isn't a perfect Dirac pulse nor a square pulse, because of neurotransmitter diffusion at synaptic cleft:
EPSC:
I_syn
|
| |\   |\     |\
|_| \__| \____| \__
|__________________> t
meanwhile for potential, when many EPS currents come in train:
V------------------ V_thr
|       __
|   /\_/  \___  /\
|__/          \/
|_______________> t
There would be equivalent pair of Isyn and IPSP but in the opposite direction. Total PSP is the sum of EPSP and IPSP.
If new receptors are opened (new E+R parallel path in membrane circuit), by Ohm's law that means resistance decreases, therefore time constant decreases, therefore V spikes are shorter (faster decay), therefore there's less summation.
And vice versa.
• Spatial summation (cable theory)
compartmentalize dendtrites into simple patches of iso-electric properties.
suppose 3 compartments:
- dendtrite 1
- dentrite 2
- soma, where final decision is made
    _____| |_____
   |     | |     |
   |             |   |
 --|             |- -||| outside   <- dendrite 1
|  |       |     |   |
|  |__/\/__|  |---
|          |
|
/
\ intracellular Resistance due to difference in V from compartment to another
/
|
|   _____| |_____
|  |     | |     |
|  |             |   |
 --|             |- -||| outside    <- soma
|  |       |     |   |
|  |__/\/__|  |---
|          |
|
/
\ intracellular Resistance due to difference in V from compartment to another
/
|   _____| |_____
|  |     | |     |
|  |             |   |
 --|             |- -||| outside    <- dendtrite 2
   |       |     |   |
   |__/\/__|  |---
           |
space constant:
If Δλ < 0, there's less spatial summation, and vice versa.
• Firing patterns and oscillations
• single spike
-------|-------> t
IL-V curve:
  /
 /
/
IK-V curve (above IL):
  /
 /
/
INa-V curve (below IL):
    /
\  /
 \/
Σ I:
based on differential equation,
we can determine sign of derivative and whether 3 fixed points are stable or unstable:
         /
  /\    /
-/--\--/----
/    \/
-><- --><---
 s   u  s
        ^
        steady state after spike
     ^
     V_threshold
 ^
 V_rest
however, V doesn't stay at after-spike steady state, because high depolarization opens K channels and inactivates Na channels with ball-chain. therefore individual curves and total I curve changes.
after repolarizing, curves change back to normal. rinse and repeat.
• bursting
• pacemaker cell
--|--|--|--|--
due to IL being way lower, therefore Vrest moves below x-axis, it's no longer a solution. cell is always tending to depolarization (before spike).
• Plateau
plateau potential, with addition of ICa2+ T-type:
  ______
__|     |___ V(t)
--\     /--- I(t)
   \___/
this results in attenuation of spikes (adaptive habituation):
 |
 | |
_|_|_|__
• LTP/LTD, pattern storage & recall
- 1890: Pavlov
- William James, Principles of Psychology: Elementary Law of Association "When two elementary brain processes have been active together or in immediate succession, one of them, on reoccurrence, tends to propagate its excitation to the other"
- 1940s: Donald Hebb, Hebbian Synaptic Plasticity (rephrases James). "Coincident Pre- and Postsynaptic activity will lead to strenghening of the synapse."
- 1971: David Marr, Theory of Archicortex (hippocampus). Autoassociative network, relies on hebbian plasticity.
at that point it was all theory. first experiment came from Bliss & Lomo, 1973:
- Rabbit Dentate Gyrus (close to Marr's hippocampus)
-
In vivo, extracellular recording of LFP EPSPs after estimulation of pre-synaptic neurons.
-
recordings of normal EPSPs in time:
_/\_ _/\_ _/\_
-
By serendipity, they gave tetanic (high freq) stimulation for 10 s
-
EPSP was stronger, and lasted for weeks
   /\      /\
 _/  \_  _/  \_
If normalizing peak amplitude against an original denominator, plot of EPSP points over time look like this:
EPSP amp
|          ** *   *
|        **  * ***
|       *
|      *
| *   *
|*  **
|-------------------> t
- requires NMDAr activation (coincidence detector: because of Mg+ blocker, both post and pre must be active for it to allow K/Na/Ca ions flow)
- NMDAr required for induction, not expression
- requires postsynaptic Ca2+ influx (through NMDAr)
People disagreed on whether plasticity is due to presynaptic or postsynaptic. Consensus is on postsynaptic protein synthesis.
Resolution: originally the synapse is "silent" (AMPA receptors aren't originally there, by the action of NMDAr, LTP inserts them at the postsynaptic dendrite).
• LTD (reverse process)
EPSP amp
|** *   *
| **  * ***
|          *
|           *
|             * **
|              *  **
|-------------------> t
- requires NMDAr activation (as with LTP).
- NMDAr receptors required for induction, not expression (as with LTP).
- requires postsynaptic Ca2+ influx (through NMDAr) (as with LTP)
Difference lies in that stimulation is low frequency, around 1 Hz, for 1 min. Removal and insertion of AMPAr depends on different enzymes. Insertion enzymes have low Ca2+ affinity, removal enzymes have high Ca2+ affinity.
• Cascades and Transcription
Prof. Avtar Roopra's lectures
translation is required for induction of long term potentiation, but not for maintenance. anysomicin/actinomycin-D application before or after stimulation doesn't impair potentiation, only during stimulation.
• Transcription and splicing
• Transcription
element: short functional sequence of DNA.
In essence, RNA polymerase binds to promoter and starts transcription to mRNA.
eukaryotic promoters:
- TATA Box (TATATT, etc.)
- in neuron genes, GGGGG... is another common motif
Full process actually requires a pre-initiation complex with 6 steps, starting with TBP, helicase to un-braid DNA and several transcription factors.
• Splicing
gene could have contained introns (non-Coding Sequences), which are discarded later on by alternative splicing. splicing at junctions is performed by destruction complex.
anatomy of mRNA:
   |CAP|UTR|AUG(start)|CDS|...|CDS|UTR|AAA.. (poly-A tail)|
                         mRNA
     ↑
     | splicing
     |
3'   ...UTR|AUG(start)|CDS|nCDS|...|CDS|nCDS|stop|UTR... 5'
             heterogeneous mRNA (pre-mRNA)
     ↑
     | RNA polymerase (transcription)
     |
3'   ...UTR|AUG(start)|CDS|nCDS|...|CDS|nCDS|stop|UTR... 5'
                          DNA
• Enhancers
suppose:
3'|10000 bp|promoter|300bp|
^RNA Polymerase II + transcription factors = RNAP complex
add sequence to tube filled with salt and ATP buffers: no transcription.
add TBP (TATA Binding Protein) + TAF_n factors = TFIID complex: moderate transcription.
add bunch of other things: maximal transcription (that something else enhances transcription).
remove preceding 10000 bp: back to moderate transcription.
that means something in the discarded base pairs together with extra proteins (extra transcription factors) enhances transcription: epigenetically targeted sequences. The extra proteins are known as enhancers or activators.
enhancers can be positioned in various locations relative to gene: downstream (5'), upstream (3') or even at introns.
In the case of c-fos, it turned out to be the CREB protein and corresponding cis sequence (CRE sequence: cAMP Response Element Binding protein).
Mark Ptashne's model of transcription factors:
() <- activation domain
() <- DNA binding domain
____________________________________ <- DNA
activation domain was hypothesized to interact with epigenetic signal. to demonstrate it, AD is replaced by some sham protein, which is heterologous to another piece which now contains a synthetic activation domain. this restores expression:
moreover, activation domain was shown to be enough to bring TAF complex, or even whole RNAPII.
many genes have more than 1 promoter.
• Chromatin packing and gene regulation
late 1800s Germany: nucleus divided in 2 regions:
- heterochromatin: darker patches, denser after centrifugation
- euchromatin: rest of nucleus, lighter after centrifugation
active vs inactive genes:
- euchromatin: active genes (as shown by reporters/immunohistochemistry.
- heterochromatin: inactive genes.
histones (basic, positively charged):
H2A|H2B      <- upper cover
_______
H3|H4|H3|H4  <- roll
__________
H2A|H2B      <- bottom cover
in addition, each subunit carries a tail approx 33-34 aminoacids long:
e.g:
H3 -----------------------N
     K27    K9       K4     <- lysines
147 bp around each histone protein.
in heterochromatin, lysines are positively charged, whereas the phosphate backbone is negative. in euchromatin/unrolled DNA, lysines are acetylated.
2 catalyzed reactions for going back and forth between positive and neutral tails:
- hetero -> eu: uses acetyl-CoA, esterification leaving CoA residual. GCN5 enzyme
- eu -> hetero: uses H20, hydrolizes with acetyl-group residual. RPD3 enzyme.
catalized in the order of minutes:
                      acetyl-CoA           CoA
                            \HAT(e.g. CBP) /
transcription OFF H3-K-NH3^+ ---------> H3-K-N-OAc transcription ON
                             <---------
                               / HDAC \
                vinegar(acetate)        H2O
glossary:
- HAT: histone acetyl transferase
- bromo domains: domain at CBP-like proteins to recognize lysines (and then acetylate them using KAT domain).
- HDAC: histone de-acetylase
CREB Binding Protein (CBP, which binds to CREB's active domain) was shown to share sequence with GCN5, meaning that gene activation or silencing is mostly done through mechanical unrolling of DNA, to allow transcription machinery to bind to genes.
CBP
(CREB) <- activation domain
(CREB) <- DNA binding domain
____________________________________ <- DNA
CRE
opposite process (wrapping/making histone tails positive. E2F can work both to activate or deactivate):
RDP3
Rb (retinoblastoma protein: named after its dysfunction in cancers)
(E2F) <- activation domain
(E2F) <- DNA binding domain
____________________________________ <- DNA
e-box
thus separate fields of histone packaging and gene regulation got reconciled.
• Chromatin packing and gene regulation II
Soviet scientists discovered the story wasn't as crystal clear. euchromatin still had some lysines which were methylated, and positively charged. why? do they serve a function?
       CH3
        |
  CH3 - N+ - CH3
        |
K27     K9        K4
--------------------- N
Kouzarides at Cambridge came up with simple experiment. he hypothesized there was some protein which bound to them.
western blots and gene characterization showed that protein was HP1: Heterochromatin Protein 1:
\ /
/ \
  ^ chromoshadow domain (dimerizes with other HP1's chromoshadow)
^ chromo domain (binds all 3 methyl residues)
HP1 proteins compact DNA by cross-linking histones (or rather, whole nucleosomes):
      |                  |
      |---HP1--><--HP1---|
      |                  |
---histone1----DNA----histone---
HP1 always binds K9. other proteins with chromo domains were later found which bind specific lysines. E.g. unmodified K4: NuRD complex + HDACs + ATPase.
• More suppression mechanisms
yet more reconciliation between DNA folding and gene expression:
HP1, and other histone modification 'binders' are sometimes called 'Readers' (they read chromatin modifications)
SUV39H, and other histone modifying enzymes are sometimes called 'Writers' (they write modifications).
        t               t+1
   (SAM)(**HP1**)        (**HP1**)(SuV39h)
  (SuV39h)(HDAC)         |
        Rb               |
      (E2F)              |
      (E2F)              |
______________________histone____
e-box
how does a gene like BDNF know that it should be expressed in neurons only (or mostly)?
     HDACs                     histone methylase
      SIN3                   G9a
N Repressor Domain     C Repressor Domain
                  \   /
                   DBD
5'  _____Represor Element 1 (RE1)__|BDNF|_____ 3'
sometimes the DNA itself is methylated. these CpG items tend to be close to promoters, and amount of methylation correlates with suppression of nearby genes.
          CH3
           |
5' -------CpG-------- 3'
• Regulation by neuronal activity
        glu glu     Ca2+ Ca2+
          glu          Ca2+
         GPCR          NMDAr
--------|    |---------| |-----
--------|    |---------| |-----
        GDP+ɑβɣ        Ca2+
          ↓             ↓
         GTP+ɑ         ryanodine receptors in Endoplasmic Ret.
          ↓             ↓
cAMP (2nd messenger)    Ca2+      Ca2+    Ca2+
          ↓             ↓                 ↓
         PKA             Cam-Kinase IV     PKA
______________________________________________________________________<- nucleus
         CBP <- **can only bind to CREB after phosphorilation by PKA and CamKIV**
        (CREB)
  _______CRE_______|early response genes (c-fos,BDNF,Arc,AMPAN,Homer)|
patients born with Rubenstein-Taybi syndrome have single allele of CBP, severe cognitive decline.
also, ketone bodies inhibit HDAC (therefore promote more extended gene expression): keto diet.
consider LTP experiment
EPSP
|   ________
|  |
|  |
|__|
_________________ t
after rapamycin application, which inhibits mTOR:
{growth factors, neurotransm} -> {PI3K, AKT, MAPK} -> {TSC1, TSC2} -| {mTOR} -> CAP-dependent translation
                                                          _
                                                          |
                                                         AMPK (energy sensor, if ATP levels are low
                                                         (AMP is high), it inhibits cascade)
EPSP
|   _
|  | \
|  |  |
|__|   |____
_________________ t
• Sensation
Prof. Raunak Sinha's lectures.
• GPCRs
Nobel Prize in Physiology 1994, Nobel Prize in Chemistry 2012.
- largest cell surface protein family. 4% of human genome
- activated by diverse stimuli: light, odorants, nucleotides, peptides, neurotransmitters, chemokines, protein hormones
- most ubiquitous drug target
basic structure of β2 adrenergic receptor (homologous with rhodopsin):
- 7 TM domains
- amino NH3 exterior terminal (N terminal)
- carboxil (COO-) terminal in cytosol (C terminal)
location of agonist binding site:
- class 1: TM domains (3-6) (Ach, DP, E, 5HT, photon, olfactant)
- class ii: N terminal (peptide hormones, somatostatin, met-enkephalin, orexin)
- class iii: inside ball hanging from N terminal (mGluR, GABA_B)
- class iv: (pheromones)
- class v: frizzled and smoothened
2nd messenger pathways
- Gs: Gɑ+GTP -> (adenylate cyclase) ATP -> cAMP -> PKA activation
- Gi: Gɑ+GTP -> (adenylate cyclase) ATP -> cAMP -> PKA inhibition
-
Gq: (phospholipase C) PIP2 -> DAG + IP3 ->
- IP3 -> smooth ER IP3 receptor -> ER Ca2+ -> Calmodulin-dependent PK
- DAG -> PKC
evidence for G-protein pathway:
- G-protein activation/deactivation absolutely requires GTP
- non-hydrolyzable GTP analogs: GPT+Gɣ activates, GTP+Gβ inhibits
- cholera toxin irreversibly activates Gɑ subunit
- pertussis toxin inhibits
conformational change:
when receptor is activated, Gɑ opens and releases GDP, GTP enters cavity and takes its place.
regulation by exchange factors (facilitators). 2 kinds of G proteins carry GDP at rest:
- monomeric G proteins: similar to Gɑ, hydrolize GTP -> GDP in cytosol.
- hetero-trimeric G proteins (ɑ, β, ɣ subunits)
GPCR and Guanine-Exchange Factors catalyze GTP exchange to activate Gɑ.
G-protein has GTPase activity to terminate active state (GTP -> GDP + P).
cAMP-dependent protein kinase:
- inactive PKA: 2 catalytic subunits are blocked by autoinhibitory domains of R (regulatory) subunits.
phospholipase C (PLC):
- phosphilipid in membrane (PIP2)
- DAG (still hydrophobic) -> PKC
- IP3 (phospholipid head) diffuses and reaches IP3 receptors at endoplasmic reticulum -> Ca/calmoduline PK, etc.
diversity of G-proteins:
- β2 adrenergic: Gs
- Dopamine: Gi
- mGluR, type 1 mAch: Gq
more diversity of 2nd messenger mechanisms:
in Ach muscarinic type 2, Gɣ actually has a role. it opens K channel directly. not as fast as ionotropic channels, but much faster than 2nd messenger cascade.
signaling to nucleus.
• photoreceptors
retina has more cellular diversity than the whole cortex.
Schultze's 1866 Duplex theory: rods and cones: proportion of cones/rods between species must mean one mediates dim vs bright vision.
very specialized neurons. 3 segmens:
- outer: all about phototransduction, disks made out of plasma membrane foldings. non-selective cation (Na/Ca channel open by default). also, Na/Ca-K pump.
- inner: normal intracellular matrix , nucleus and organelles
- synaptic terminal: constantly depolarized and releasing neurotransmitter in dark
• opsin GPCR
- chromophore (11-cis retinol, derived from vitamin A) accross TM in the middle of the GPCR/opsin's 7 passes, extremely thermostable.
- photon (E=hv) transforms 11-cis retinal to all-trans retinal (straightens the molecule)
nomenctlature for visual receptors:
- receptor: GPCR, opsin
- ligand: chromophore, pigment, retinal
- receptor+ligand: rhodopsin (rods), cone opsin (cones)
evolutionary diversity:
- mouse: bichromats (blue, green)
- primates: trichromats (+red)
- zebrafish: zebrafish (+UV)
- mantis shrimp has ~33 opsin transcripts
• phototransduction
each outer fold in cell has many opsin GPCRs.
2nd messenger isn't ATP->cAMP but cGMP->GMP.
photon -> Rh -> Rh* -> transducin (Gɑ + GTP) -> ...(neither AC nor PLC, but) ...
-> (Gɑ + GTP) + GAP complex + PDE protein (cGMP-phosphodiesterase: cGMP hydrolizer) -> ...
-> **cGMP** -> **GMP** -> ...
this depletes cGMP bound to cation channel, replacing it for GMP -> closed state.
Na/Ca channels (mostly Na) are ligand-gated. can be regulated by phosphorilation or calmoduline.
cones have faster kinetics.
• inactivation
recovering opsin and G-protein:
- GRK1 (rodophsin kinase 1) phosphorilates rhodopsin
- arrestin binds to phosphorilated rhodopsin, preventing light from hitting it
- all-trans -> 11-cis
also, changes of PDE protein accelerates disgregation of PDE+GAP+Gɑ
• adaptation
turning on guanylate cyclase: opposite of channel opening by cGMP->GTP exchange
GTP -> GC+GCAP+Ca+ -> cGMP
when less Ca+ is available, concentration of cGMP increases. one of the main mechanisms for light adaptation.
There's a 2nd mechanism for adaptation: calmodulin acting directly on channel.
• rod vs cone
although overall mechanism is the same, rods and cones occupy opposite ends of the speed-sensitivity tradeoff:
- rods: dim light (scotopic), sensitivity to scarce photons, slower response
- cones: opposite
thermal stability is critical to reduce baseline noise
GPCR allows single photon detection to amplify signal. 1 rodopsin activates many surrounding G-proteins.
membrane proteins are densely packed in 2D membrane, membrane is high in unsaturated fatty acids, increasing probaility of reaction even further.
amplification:
1 rhodopsin -> ~100 G-transducin and PDE -> 1x10^5 GMP -> ~1000 closed channels
single-photon response is very reproducible. lifetime of molecule phosphorilation (inactivation) has very low-variability.
• Retinal transmission
if photoreceptors are constantly depolarized and releasing at rest (even if analog), how is neurotransmitter not depleted?
because of...
• ribbon synapse
- thethered vesicles along a ribbon, 10-fold increase.
- allows graded transmission of electric signals
- support a continuous and high-hroughput mode of release
-
well-suited for rods and cones, which continuosuly release Glu
-
rod: single ribbon
- cone: many ribbons
functional specializations of ribbon synapse
- multivesicular release (not quantal minis).
- L-type Ca channels. slower activation and deactivation kinectics to match multivesicular release. depolarized resting state allows these channels to work continuously
• triad synapse
signal transfer from photoreceptors to bipolars:
- 1 rod -> {2 horizontal, 2 bipolar}
- 1 cone -> {2 horizontal, 1 ON bipolar, 3 OFF bipolar}
There are ON bipolar and OFF bipolar cells. receptive-field wise, ON bipolars detect bright center, OFF bipolars detect dark center (aided by lateral inhibition to create edge detection, see below).
metabotropic signaling in inverting ON bipolar:
glu -> mGluR6 -> G-protein -> Gɑ+GTP -> inhibition of non-selective TRPM1 Na/Ca channel
ionotropic signaling in conserving OFF bipolar and horizontal:
Glu -> AMPA or kainate -> depolarization
• pathways
tight correlation between how deep the bipolar laminates into retina and function.
• rod
rod pathway features a lot of convergence. single RBC pools 20-100 rods
non-linear threshold (see computational neuroscience lecture notes). single-photon responses larger than 1.3 times average are retained. almost 100% of rod single-photon responses are ignored. nonlinear threshold increases SNR by 350%.
molecular mechanism: mGluR cascade. In darkness most of the cascade leading to TRPM1 is saturated. single-photon event is usually not enough to desaturate it.
• cone
fovea is very injective, whereas periphery displays degeneracy.
• horizontal cells
horizontal cell creates lateral inhibition: center ON + surround OFF, and vice versa.
downstream target: photoreceptors themselves (feedback from other photoreceptors in the surround area). delta-I Ca channel response curve is shifted to left.
proposed molecular mechanisms of feedback inhibition:
- GABA hypothesis (doesn't involve Ca channel, acts directly in GABAr)
- ephaptic hypothesis (involves Ca channel as target)
- pH hypothesis (also involves Ca channel as target)
• color vision
horizontal cells also play a crucial role mixing cone signals for color vision.
color sensitivity curves are in fact very broad, there's a big overlap. color vision also depends on opponency of spectrally-different, mixed cone signals.
- red,green opponents (red+ green- and viceversa)
- blue,yellow opponents
• gap junctions
there's also electric coupling between different cells. this is evidenced by linear I-V curves during simultaneous recording. site of contact is axon terminals.
- rod-rod coupling: alternative pathway for conveying rod signals at dusk/dawn for efficient coding of faintly backlit objects.
- cone-cone coupling: improves the signal-to-noise ratio thus improving visual resolution.
- rod-cone coupling: might be important for integrating rod signals into the cone pathway under mesopic light conditions.
- horizontal-horizontal coupling: allows the dynamic enlargement of receptive fields up to several millimeters.
• smell (chemosensation 1)
humans can detect between 10k and 100k different odors.
• olfactory transduction
regular Gs pathway. endpoint is CNG channel (nonselective cation channel, as in phototrasnduction, but polarity is normal. Odor results in channel opening).
as in phototransduction, influx of Ca has an inhibitory modulatory effect in conjunction with CaM.
important difference: GABA/glycine is depolarizing, Cl- leaves cell (similar to brain during early development). this amplifies odor-evoked response. positive feedback.
Ca-activated chloride current
• Ca dual role
- excitatory: rise in intracellular Ca concentration opens Ca-activated Cl channels in ciliary membrane.
- inhibitory: canonical negative feedback on CNG channel (and other components of cascade, e.g. AC). adaptation: both short and long-term, both dependent on Ca.
• GPCRs
Buck and Axel, (Cell 1991) used degenerate PCR to amplify many sequences from olfactory epithelium and discovered a whole family of GPCRs to detect odorants: olfactory receptors (ORs). Nobel Prize in Physiology and Medicine 2004.
high aminoacid variability in transmembrane passes. Odorant binds to cavity as retinol in rhodopsin.
• ORs
highly distributed anatomical expression in olfactory epithelium.
single olfactory sensory neuron expresses single OR gene.
combinatorial response:
odor <-> OR mapping isn't injective though. there are more detectable odorants than ORs. each odorant depends on a different combination.
Valence roughly depends on whether compound is alcoholic or acidic (carboxilic acid). hexanol, heptanol, octanol, nonanol are perceived as pleasurable, whereas hexanoic acid, heptanoic acid, octanoic acid and nonanoic acid are disgusting.
coding in Olfactory Bulb:
spatially distributed epithelium neurons coding for same OR project to the same glomerulus in the OB.
• cortex
tufted cells and mitral cells project to layer-IV pyramidal neurons. many cortical targets:
- AON
- OT
- PC
- amygdala
- Enthorinal cortex
cortical processing is poorly understood.
• vomeronasal organ and pheromones
TODO: bring info from UNAM lectures.
• taste (chemosensation 2)
papillae (bumps) contain taste buds, which in turn contain taste receptor cells.
types of taste receptors:
- type I: ~50% of total. narrow morphology, they ensheath other taste cells and seem to have glia-like functions.
- type II: ~33% of total. more spherical morphology. main mechanism of chemosensation, they use GPCRs too.
- type III: differential expression accross tongue, scarce on anterior papillae, more numerous posteriorly. slender morphology.
primary taste qualia:
- sweet: sugars (fructose, sucrose, maltose), proteins (monellin), aspartame, saccharin, sucralose.
- bitter: Ions (KCl, Mg2+, Chinin, caffeine, denatonium)
- salty: Salts.
- sour: Acids.
- umami: Proteins, monosodium glutamate, etc.
bitter threshold is lowest, to allow potentially dangerous substances to be detected.
| taste | substance | absolute threshold |
|---|---|---|
| bitter | quinine | .000008 M |
| umami | glutamate | .0007 M |
| sour | HCl | .0009 M |
| salty | NaCl | .01 M |
| sweet | sucrose | .01 M |
• salty
Beidler, 1953 argued that response of cat tongue was fast enough to use ionotropic receptors.
search for epithelial sodium channel (ENaC): Reverse-Transcriptomics PCR showed that subunits of ENaC, alpha, beta, gamma.
very straightforward mechanism: Na-gated ionotropic in membrane -> depolarization.
yet a portion of response (~20%) wasn't sensitive to ameloride. rest might be due to TRPV1 (metabotropic).
• sour
stimulus is acidification (pH decrease) inside the taste cell.
many channels have been implicated:
- hyperpolarization-activated cyclic-nucleotide-gated (HCN)
- Acid-sensing ion channels (ASICs)
- Potassium (K2P) channels
- H+-gated Ca channels
- Acidic inactivation of K+ channels
most solid evidence: KO transgenic Otop1 gene. Hardly any response after KO.
when proton enters cell through Otop1, ΔpH blocks K channel (GIRK: K inward rectifying), which in turn leads to depolarization.
• sweet, umami, bitter
rest of flavors are due to GPCRs.
subunits first identified by screening for mRNAs preferentially expressed in mouse taste buds. novel GPCR expressed in small subset of receptor cells. taste receptor type 1 and 2 (T1R and T2R), hypothezised to combine as heteromeric polymers.
T1R distantly related to metabotropic glutamate receptors (mGluRs), vomeronasal receptors and GABAB receptors. T1R forms heteromeric dimer with subunits T1R1, T1R2 and T1R3.
T2Rs are a family of ∼30 taste-specific GPCRs distantly related to opsins. short amino termini and may function as monomers or dimers.
evidence from matrix of subunits KO times flavor. responses are abolished.
• signaling cascades
main one: PLC patchway (Gq) -> Trpm5 (Na permeable) and Panx1 (ATP permeable) channels. Although not released using vesicle exocytosis, ATP is used as neurotransmitter.
others:
- T1Rs (sweet, umami): AC -> cAMP -> PKA
- T2Rs (bitter): NOS -> NO -> sGC -> cGMP
• coding
popular misunderstanding: there's no tongue map. responsiveness to all 5 main flavours is distributed across tongue, as with the olfactory epithelium.
individual cells are mostly tuned to single flavours, however. yet, over 90% of cells are at least partially responsive to more than 1 basic flavor.
specificity of whole cell buds is still debated. competing models:
- labelled-line: each cell is tuned to single taste.
-
cross-fibre models
-
cells detect many flavors
- cells detect single flavors, but they get mixed at level of afferent fibers.
combinatorial models say there are both generalist taste bud cells and specialist cells, so picture may be even more complicated.
primary sensory cortex is the posterior insula.
• somatosensation (mechanotransduction 1)
single dorsal ganglion root cell is responsible for both sensing and transmission to CNS.
myelination and thicker myelin sheet increases velocity of transmission (because capacitance is increased). Thermal receptors and nociceptors have small-diameter axons and unmyelinated (type IV) or thinly-myelinated (type III) fibers. Opposite case for touch and proprioception.
- epidermis: nothing, neurally speaking.
- dermis:
- Merkel's disk SA1
- free nerve ending
- Meissner's corpuscle RA1
- Hair follicle receptor
- Pacini's corpuscle RA2
- Ruffini's ending SA2
RA, SA: rapidly adapting, slowly adapting
All of them have low threshold for activation.
classification by location of innervation:
- type 1: superficial. single fiber branches out into multiple receptors.
- type 2: deeper dermis. single fiber innervates single receptor.
• functional properties
timing:
      ____________
 _____|           |____ <- stimulation
      |||         |||   <- FA (phasic response, Meissner, Pacini)
      ||||| | | | || |  <- SA (tonic response, Merkel, Ruffini)
intensity and location of receptive fields:
size of receptive field is proportional to depth. size of corpuscle is also increased at deeper levels.
| Merkel (SA1)
| Meissner (RA1)
| Pacini (RA2)
| Ruffini (SA2)
|
˅
(bigger receptive field)
• molecular basis
Coste el al. Science (2010) found the Na-Ca ion channel which is opened after mechanical deformation of cell membrane, after testing hundreds of cloned genes: the Piezo1 channel. also found in many internal organs, and even roots of plants. Nobel Prize in Physiology 2021.
- Piezo1 (in HEK cells) is extremely long: 24 to 36 transmembrane domains.
- Piezo2 is expressed in RA dorsal ganglion neurons.
other channels implicated in mechanotransduction (C. elegans, etc.): DEG/ENaC, TRP, TMC1, TMHS, TMIE, K2P.
Piezo1 structure and gating:
- 3 blades
- each blade/subunit has intra latch, beam, clasp and the piezo repeats
- gate is probably deformed mechanically when membrane is deformed.
• temperature
• nociception
• proprioception
TODO: bring info from UNAM lectures
• hearing (mechanotransduction 2)
• hair cells
outer hair cells differ from inner hair cell. inner cell is involved in boosting/amplification.
separated by tunnel of Corti.
supporting cells:
- Deiters' (below outer and inner hair cells).
- Pillar cells (make Corti tunnel)
endolymphatic vs perilimphatic
- E. Potential = +100 mV, high in K+.
- P. Potential = normal extracellular potential, right outside hair cells.
receptor potentials are perfectly amplitude-locked and phase-locked to some frequency component of heard stimulus.
• mechanotransduction
each cells can have 50 to 100 stereocilia (modified microvili). tallest one is called knocilium.
cross-section:
Outer Hair Cell:
|
||
|||
cell
body
Inner Hair Cell:
|
|
|||
cohesion when bending is produced by inter-ciliary links of different kinds.
• MET channel
there are also tip links, at the cilia tips, making HC extremely sensitive to deflection (~1 nm). tip link opens channel (MET channels).
When opened, K+ from endolymphatic fluid enters the cell.
location of MET channels:
Beurg at al., Nat Neuro (2009) showed that Ca fluoresence mostly increases for smaller rows of stereocilia, not the tallest one, suggesting there are no channels facing on the direction of negative (closing) deflection.
(diagram is missing tip links):
       /
   /* /
/*/  /  ---> positive deflecton
(channels = *)
identity of MET channel:
TMC2 dominates in early stages of development, then TMC1 takes over. KO studies show transmission is obliterated without TMCs.
Ca adaptation:
tuning curves (I) as function of deflection (Δx) can shift to avoid saturation, based on Ca influx, creating greater dynamic range.
MET complex:
- TMC1/2
- TMHS
- TMIE
- PCDH15 (adapter between MET and tip link)
mutations in hair bundle proteins can cause deafness (e.g. Usher's syndrome).
• frequency selectivity
basilar membrane has 2 key properties to allow it to perform Fourier decomposition, depositing the energy from the relevant frequency at the right place as the impulse travels along the cochlea (in the oval window -> round window direction).
- width: wider towards apex -> lower frequencies towards apex
- stiffness: more flacid towards apex -> lower frequencies towards apex
basilar membrane is like a flipper for swimming!
• tonotopic map
as with subjective musical pitch, frequency is an exponential function of distance in the cochlea.
passive harmonic oscillator model:
- k: stiffness
- m: mass
- c: damper
resonant frequency depends on ratio k/m.
there are 2 pivot points involved: one at the tectorial membrane and one at the basilar membrane.
typical HC tuning curve:
dB SPL
|___      ____
|   \     |
|    -_  /
|      ||
|______________ kHz
• tuning
the mechanical (velocity and displacement) properties of the basilar membrane predict almost perfectly the neural response of specific fibers. that is, tonotopy is also preserved by the inner HC action potentials.
again, not only are hair cells at a given distance uniquely selective to some frequency, their firing rate also follows frequency and phase of their Fourier component:
mechanical wave:
       /\
  / \ /  \ / \
---------------> t
firing rate
|
|      |
|      |
|  |   ||  |
|  ||  ||  ||
---------------> t
• Outer Hair cells
it's believed that more numerous array of OHCs play active role by amplifying local vibration of basilar membrane.
destruction of OHCs or impairment with antibiotics shifts and lower amplitude of tuning curves of IHCs.
current model (notice feedback loop by OHC):
sound stim -> basilar vibration -> IHC excitation
             |               |
         force by OHC   OHC excitation
             |               |
             <- OHC modulation
transgenic studies have implicated protein called prestin in the amplification mechanism of OHCs. Cl- anions bind and unbind to prestin depending on voltage.
In this view, OHCs not only sense the basilar motion, they add motion. cell length has been shown to change with OHC depolarization, like muscles acting on the membrane.
                       |
                      ||
    |                |||
   ||                ---
  |||               |   |
  ___               |   |
 |   |              |   |
_|Cl |_ <-prestin ->|   |
_|   |_             |   |
 |   |              |   |
  ___                ___
• ribbon synapse
presynaptic contains many ribbons, each contacted by postsynaptic afferents.
HCs have simple round morphology without neurites.
IHCs don't fire action potentials either. it is thought that analog voltage allows for greater bandwidth.
MET -> K+ influx -> depolarization -> Ca2+ channels -> Ca2+ influx -> ribbon Glu
big vesicle pool allows for wide dynamic range. only mild adaptation necessary.
no synaptotagmin Ca2+ sensor. Otoferlin instead. there may not even be a SNARE complex for vesicle fusion.
Cav1.3 channel (type L): long lasting, high-voltage activated.
• vestibular
TODO: bring info from UNAM lectures
• Extra: Epilepsy
• Physiology and anatomy
1/26 people will have seizures in their lifetime, more than Alzheimer's Parkinson's and Huntington's summed together.
not a single disease, but a syndrome of disorders, described by numerous symptoms. seizures are the defining symptom.
space of seizures:
- psychological dimension: simple vs complex
- anatomical dimension: focal/partial vs generalized
| simple | complex | |
|---|---|---|
| partial/focal | simple partial | partial complex |
| generalized | tonic/clonic (grand mal), absence (petit mal) |
• EEG
- absence: high amplitude, 3 Hz on all channels. stereotypical spike-and-wave discharges
- etc.
• etiology
- initial insult
- genetic mutations (channelopathy)
- epigenetic changes (channel expression, or channel regulation)
- unknown
• proposed mechanisms
- imbalance between excitation and inhibition
- timing issues?
- bastardization of normal rhythmic mechanisms?
• Genetics
epileptogenesis: process by which seizure propensity increases over time.
- 458 genes were differentially expressed on day 1 post-Status epilepticus across all models
- MAGIC: predict transcription factors and regulators
- master regulators downregulation (in order): EZH2, RAD21, SUZ12, CTCF, GATA2, CTBP2, SMC3, POU5F1, NANOG
EZH2 in dentate gyrus' granular cells increases levels for ~20 days across status epilepticus. EZH2 works by shutting down other genes, it's a methylase.
• EZH2's role
EZH2 keeps seizure threshold high, reducing probability of seizure. EZH2 is protective.
• EZH2 targets
WT + no seizure: normal threshold WT + seizure: lowered threshold MT + no seizure: normal threshold MT + seizure: hyperlowered threshold
genes were clustered to discover similar genes. regulatory network seemingly centered around STAT1/2/3 and IRF1. cluster turned out to represent genes associated with neuroinflammation. STAT is a transcription factor, but it lives in cytoplasm of neurons:
membrane receptors -> JAK -> STAT
• STAT3-EZH2 pathway
EZH2 controls STAT3 phosphorilation by inhibiting JAK1.
membrane receptors -> JAK -> STAT
                       T
                      EZH2
treatment could be attempted using drug CP690550, an already FDA-approved drug (for different purposes).